Share of Search: A Powerful Tool for Your Investment Strategy
Published:
Alternative data is a valuable benchmark for determining a company's health and performance. Alongside traditional financial data, it provides additional signals that a company is doing well or not, and can help investors validate an investment thesis, give their investment strategy more confidence, or even identify new investment opportunities. According to Forbes, $1.1 billion was spent on alternative data in 2019 alone.
“Search would appear to be a far more universal assessment tool than the amount spent on advertising. The data for share of search would be just as relevant to sectors where standard advertising is less important.” — Mark Ritson
For decades, businesses have used Share of Voice (SoV) as a vital indicator to help them plan budgets, forecast growth, and evaluate how their efforts compare to those of their competitors. However, with previously utilized methodologies to assess advertising expenditure and production cloaked in secrecy, digital media has made measuring SoV practically difficult. Instead, an increasing amount of companies are using a new statistic called Share of Search to assess effectiveness.
What is the Share of Search?
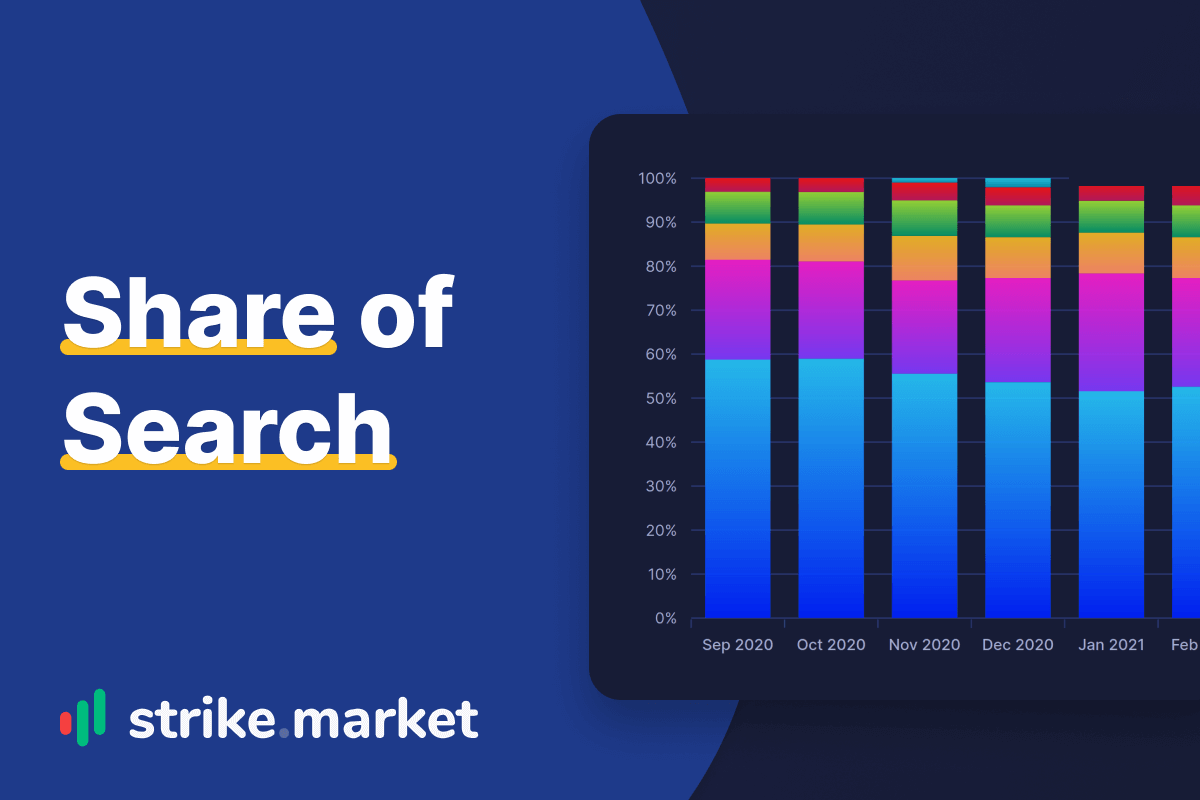
The amount of search queries for a company in relation to all search queries for all businesses defining a category is referred to as "Share of Search." It works on the same principles as sales and market share, but instead counts how many times a company's name, as well as all of its underlying products, services, technology, and so on, are Google searched.
A Powerful Performance Metric
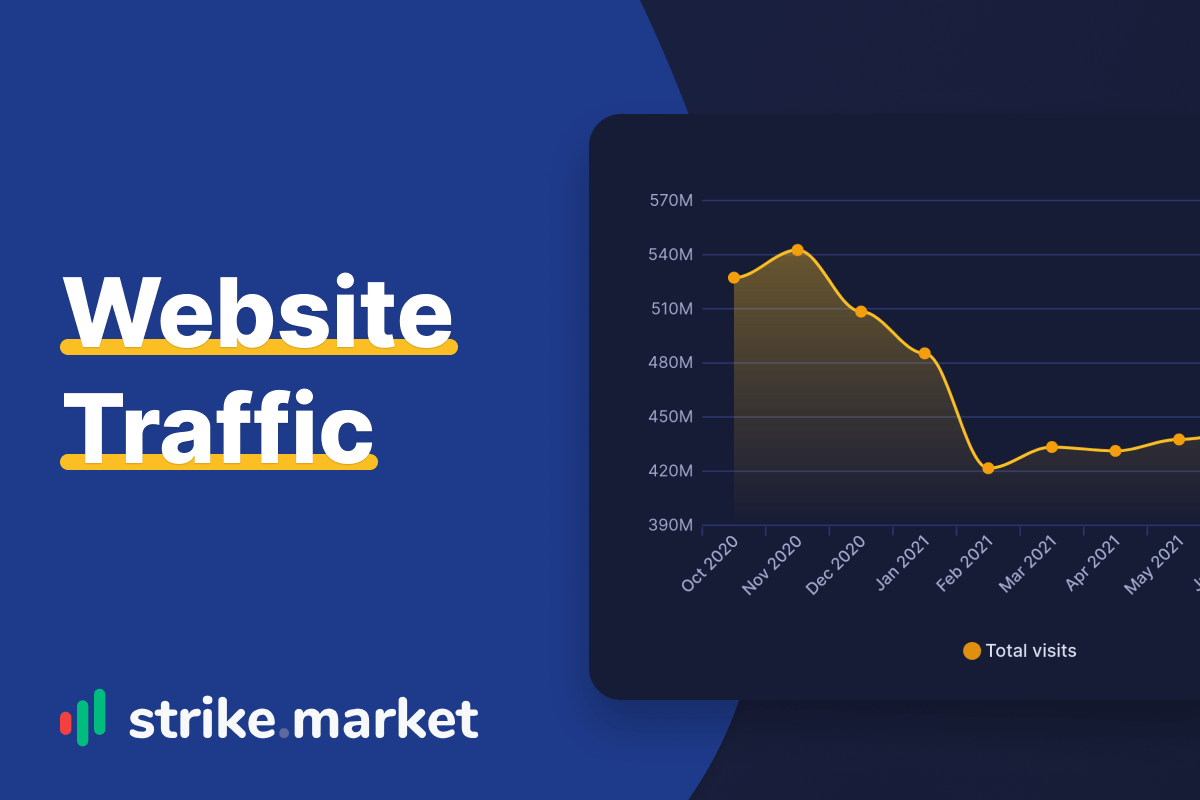
Today, searching for a brand in a search engine is a significant metric for a company since it indicates that users are paying attention and are, therefore, interested in what it has to offer. In other words, getting the attention of consumers is the daily fuel for growing companies. With 51% of all web traffic coming from organic search results and 97% of consumers searching for a business online before making a purchase or booking, search is one of the most important acquisition channels for businesses today. The ability to obtain this key metric on a regular basis is a highly powerful insight for investors, allowing them to compare a company to its competitors, as well as assess its marketing efforts versus its objectives.
Share of Search vs. Market Share
Various studies and lines of research in marketing science all point to the same conclusion: Share of Search's potential as a proxy for a brand's performance in the marketplace. And, as they point out, more specifically, its Market Share. Indeed, as demonstrated by Les Binet’s recent study, there is a clear correlation between the two indicators: If a company’s Share of Search is increasing, it may anticipate a rise in market share in the future.

EffWorks Global 2020: Share of Search as a Predictive Measure
Share of Search may also be a good indicator of the company’s health. Indeed, the more individuals are searching for a company, the more it will result in sales.
Moreover, unlike Share of Voice, Share of Search is a more global metric because it is not contingent on advertising spend. Its usefulness is recognized in a variety of industries, including B2B, where advertising can take many different forms, both monetized and non-monetized.
Share of Search = Number of searches for the company ÷ number of searches for all its competitors
Share of Search is usually assessed on a monthly basis. However, examining historical data can reveal unexpected surges in performance, reflecting unique events or successful firm tactics, providing insights into consumer spending behavior.
Now let's look at some examples.
Tesla Inc. ($TSLA)

Figure 1: This example is taken from Tesla, analysing the company’s Share of Search per model. (strike.market)
By looking at Figure 1 above, we can see that the Model 3 Share of Search has been dominant over the whole period. Therefore, we could expect higher sales volume for this model in 2021 as compared to the others. Similarly, Model X's SoS was substantial in December, which might also indicate higher sales for that period.
Cloudflare ($NET)

Figure 2: Cloudshare’s Share of Search compared to competitors. (strike.market)
This figure shows the evolution of Cloudflare’s ($NET) Share of Search between December 2020 and October 2021. The trend clearly indicates that the company is globally on par with Microsoft Azure ($MSFT) in terms of searches. This may indicate strong market shares in 2021.
Uber ($UBER) (Brazil)
 As with the previous figure, this one shows Uber ($UBER) dominating the Brazilian market for the whole period, with more than 95% of the search volume. Thus, we can easily conclude that the mobile app is taking over all market shares, which should result in strong performance in 2021.
Bottom Line
A company's Share of Search can provide insight into the performance of a new product launch, sales funnel, or specific event at the outset. Hence, analyzing this metric can, for instance, assist in predicting an earnings report prior to its release, thus indicating whether or not to invest. In today's market, investors are thriving for new signals that will allow them to a competitive edge. Therefore, we at strike.market firmly believe that Share of Search is an excellent analytical tool to add to one's strategy since it allows to gain insight into consumer behavior, forecast sales, and evaluate a company's traction in real time.